
 VIPON off-site promotion
Amazon’s operating profit improved this quarter, but AI infrastructure spending consumed more cash. For investors, the key question is when growth becomes sustainable cash returns; for sellers, higher platform profit does not mean easier orders.
This article covers Q3 ended September 30, 2026, using Amazon earnings, Synergy cloud research, and NRF and Adobe holiday forecasts. Data verified through November 4, 2026. Actuals, estimates, and judgments are labeled separately.

Two easily misread numbers: advertising revenue rose about 11% reported, or 12% excluding currency; free cash flow outflow of $42.4 billion is trailing twelve-month, not a Q3 loss.
Operating profit growth and business mix
Investor view: read revenue scale and profit contribution together.
Q3 2026 net sales were about $201.9 billion, operating profit $28.1 billion, margin 13.9%. Net income fell 2% year over year, not from core weakness; the prior-year quarter included a $9.5 billion pre-tax Anthropic gain. [1]
AWS contributed about 23% of revenue and 63% of operating profit, with segment margin about 38.7%. North America and international operating profit also grew. Percentages use reported amounts; segment operating profit is not segment free cash flow.
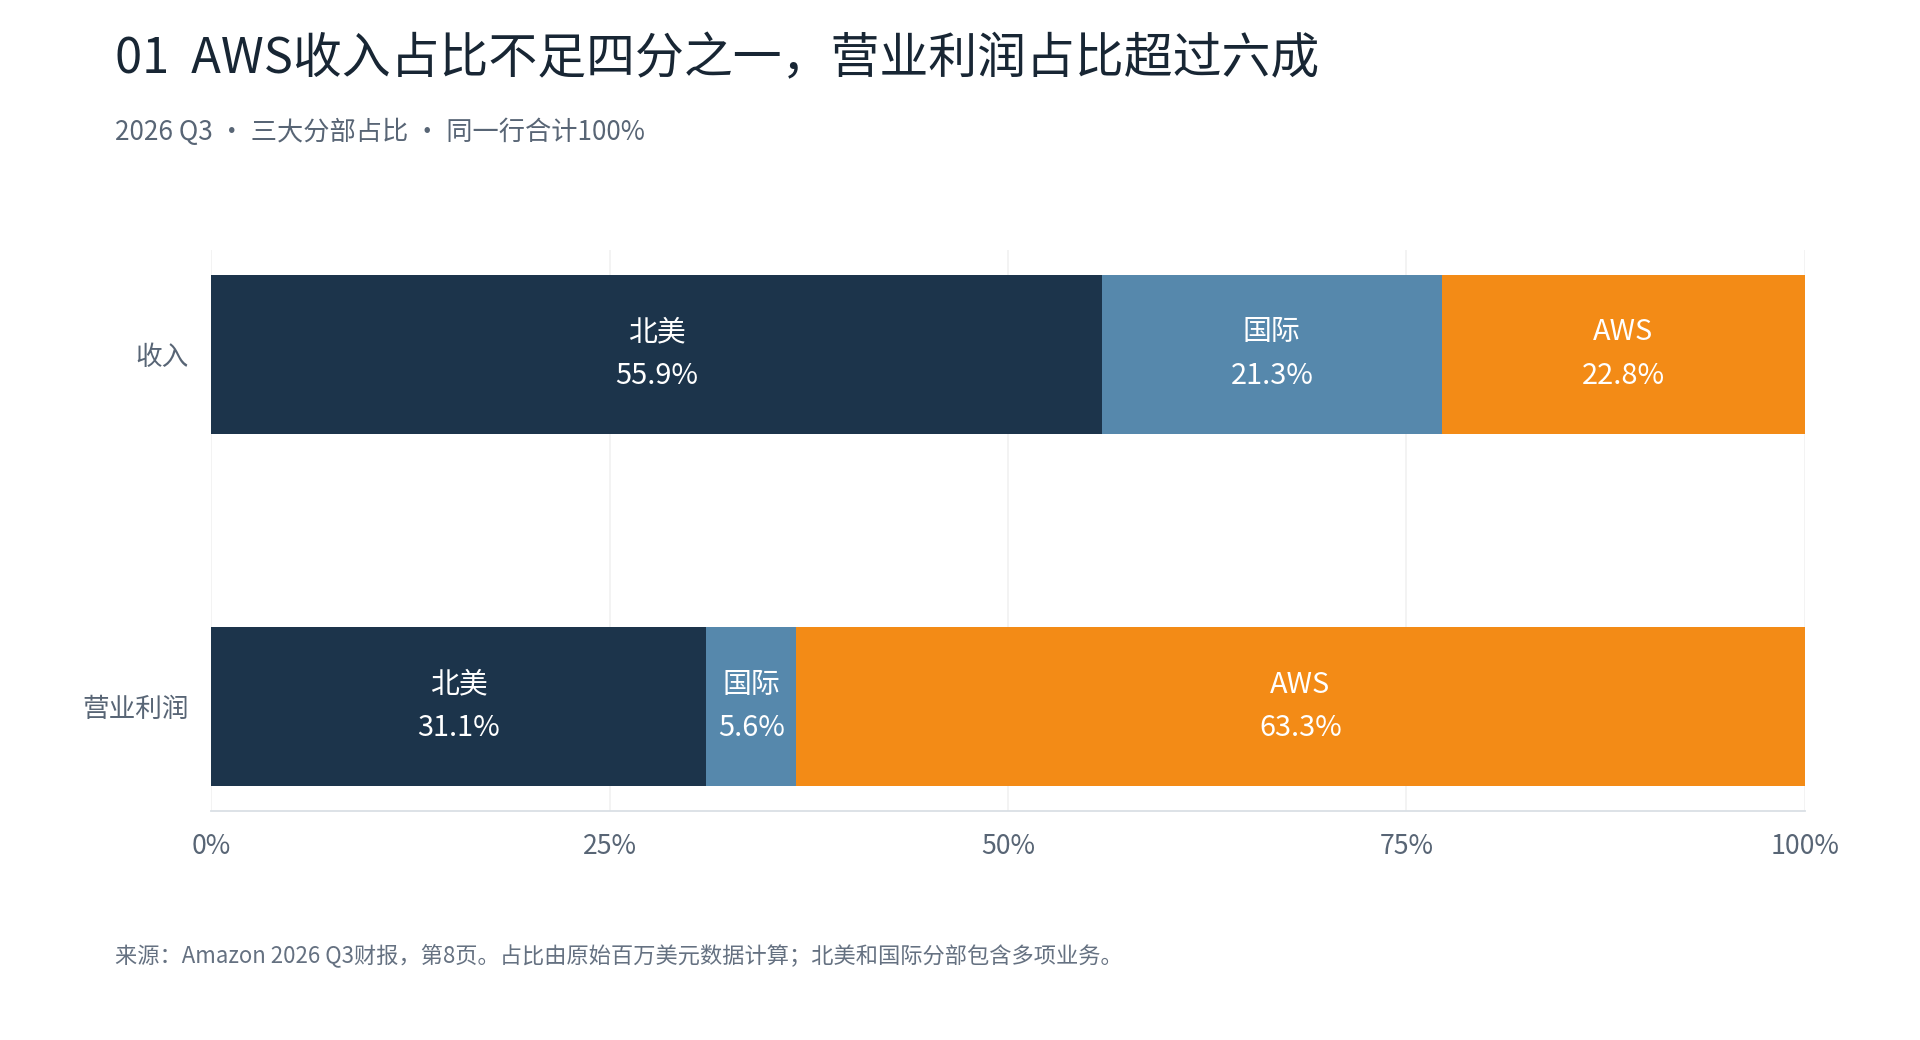
Valuation must watch AWS demand and whether retail efficiency gains continue. Amazon expects AWS revenue growth above 40% in 2027 and 2028; this is management’s expectation, not locked-in revenue. [1]
| Metric | 2025 Q3 | 2026 Q3 | YoY |
|---|---|---|---|
| Net sales | 1,801.7 | 2,019.4 | +12.1% |
| Operating profit | 174.2 | 280.8 | +61.2% |
| Net income | 211.9 | 206.9 | −2.4% |
| AWS revenue | 330.1 | 459.8 | +39.3% |
| Advertising services revenue | 177.0 | 196.4 | +10.9% |
| Third-party seller services revenue | 424.9 | 464.9 | +9.4% |
In billions of USD; YoY calculated from reported amounts.
Cash flow pressure comes from investment pace
Investor view: accounting profit and cash returns have a time lag.
Trailing 12-month operating cash flow was about $168.3 billion, net equipment purchases about $210.7 billion, free cash flow about negative $42.4 billion. Operations still generate cash; after deducting net equipment spending, a gap appears. [1]
The chart shows rolling 12-month data at six quarter-ends. Adjacent points overlap by nine months; the line shows trends, so the six points are not cumulative cash flow.
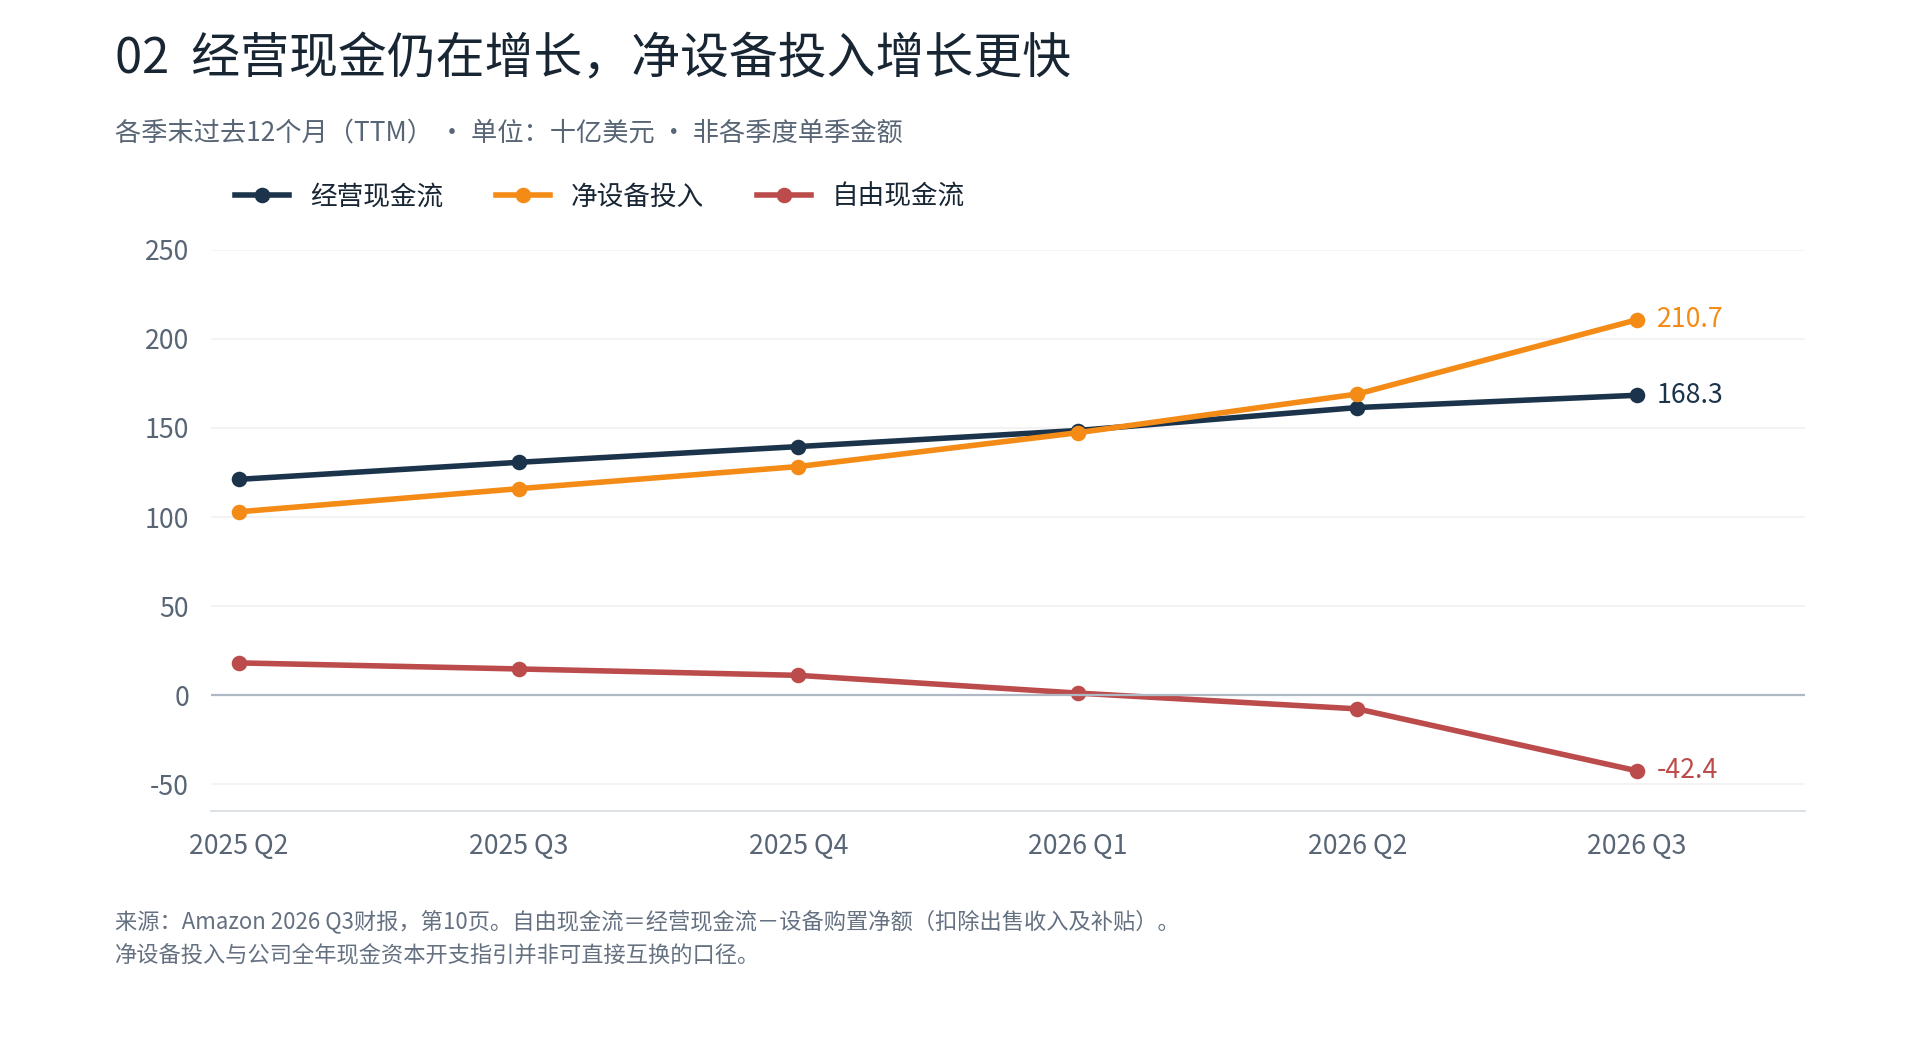
Amazon’s 2026 full-year capital expenditure guidance is about $220 billion. [2] AI equipment consumes cash first, then enters income through depreciation, so improving margins and cash flow pressure can coexist. Negative free cash flow does not mean equivalent net loss or immediate solvency crisis.
Reuters reported shares fell as much as 7% after hours, matching concerns about investment size and guidance, but market conditions also played a role. [6]
Investors should verify whether new capacity keeps producing revenue, how utilization and depreciation burdens change, and whether free cash flow improves. Without valuation assumptions, this report alone cannot show whether shares are cheap or expensive.
How platform revenue changes reach sellers
Seller view: advertising and fulfillment data do not equal store profit.
Third-party seller services revenue includes commissions and fulfillment fees, not third-party GMV. Advertising revenue covers sellers, vendors, other advertisers and formats. Amazon does not disclose average CPC, net profit, or organic traffic for all sellers. [1]
Slower ad revenue growth does not prove cheaper bids or that sellers are cutting spend. Prices, impressions, formats, and timing all affect ad revenue.
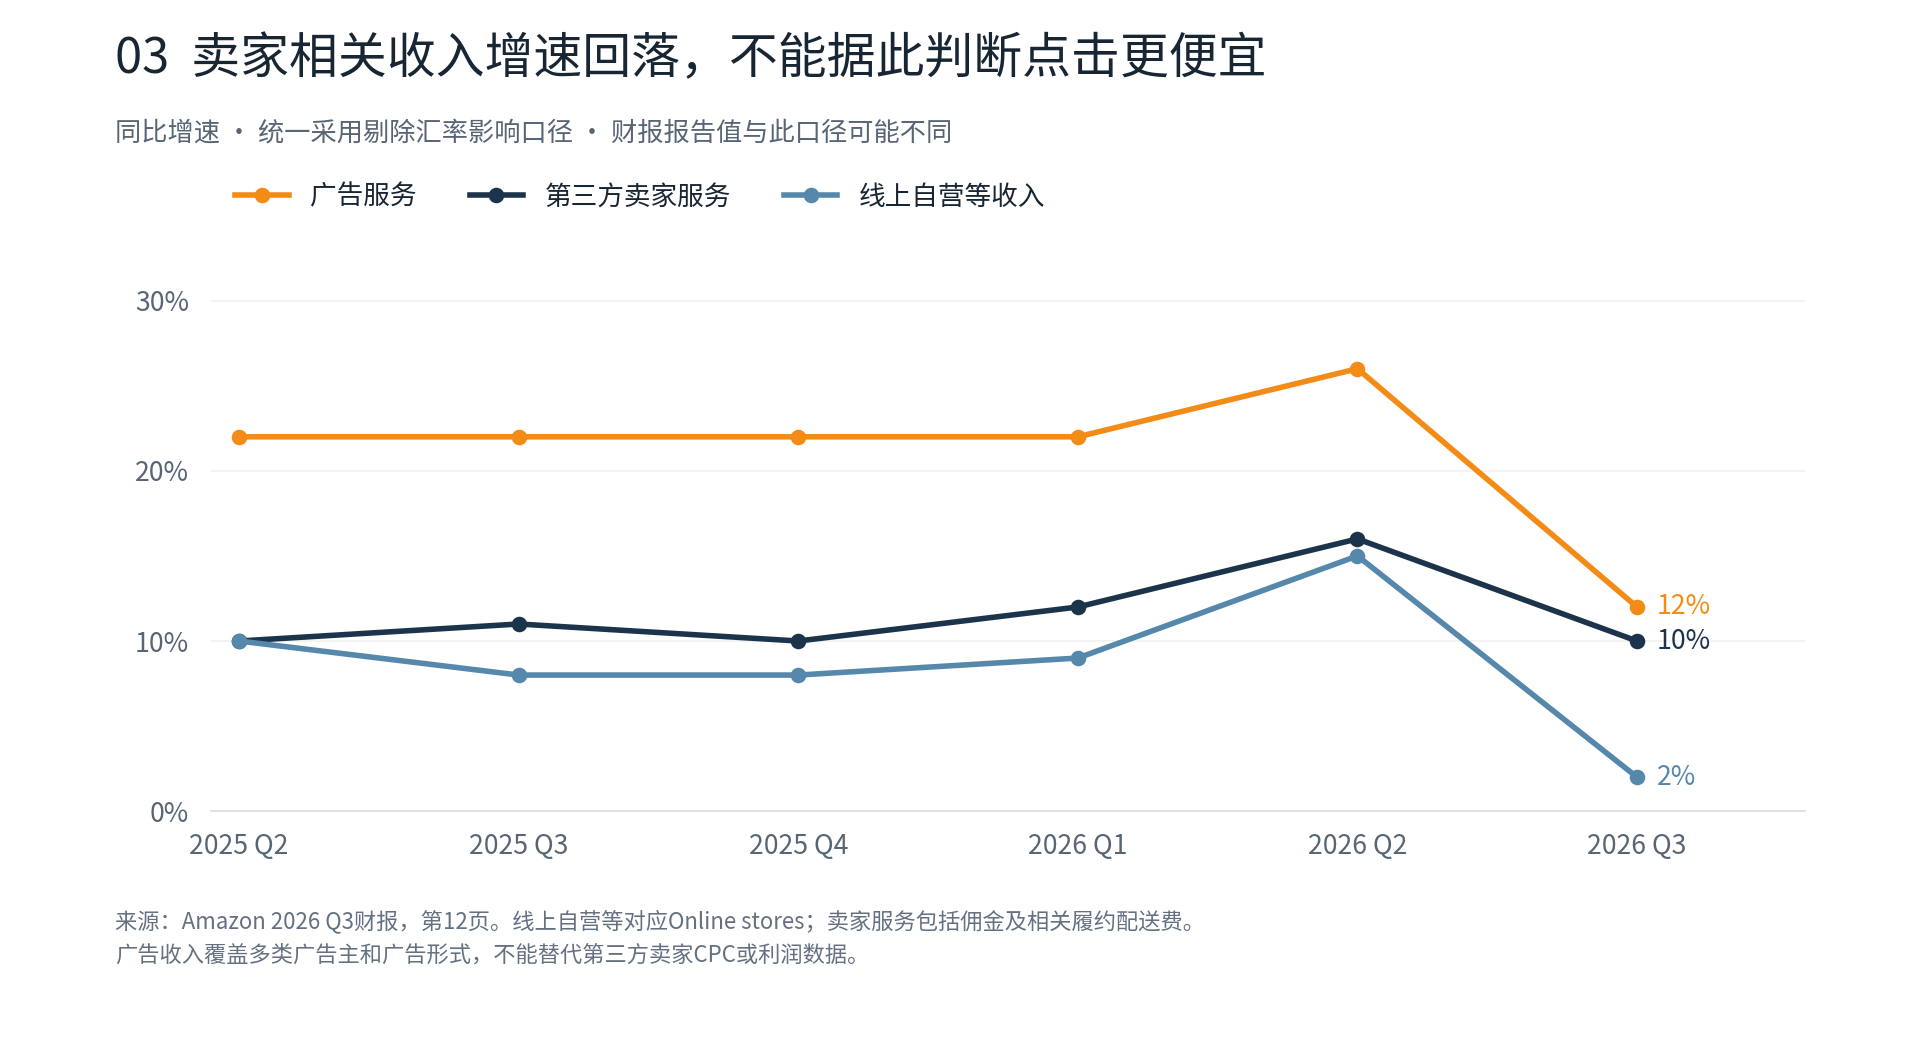
Amazon said Prime Day in most major markets moved from Q3 last year to Q2 this year; excluding this timing change, Q3 sales growth would be about 4 points higher. This is a comparable estimate, not revenue to add back, and cannot be applied to advertising or individual stores. [1]
Sellers should compare Sessions, conversion, paid price, and contribution profit around events. For off-site channels like VIPON, set test budgets and target products first; treat platform ad revenue as background and spend based on own incremental orders and profit.
Put growth into industry context
Investors watch share; sellers watch consumption scope and categories.
Synergy estimates Q3 2026 global cloud infrastructure revenue at about $167.7 billion, up 55% year over year, with Amazon share at 26%, still first. [3] Industry growth is rapid, so AWS high growth alone does not prove widening advantage.
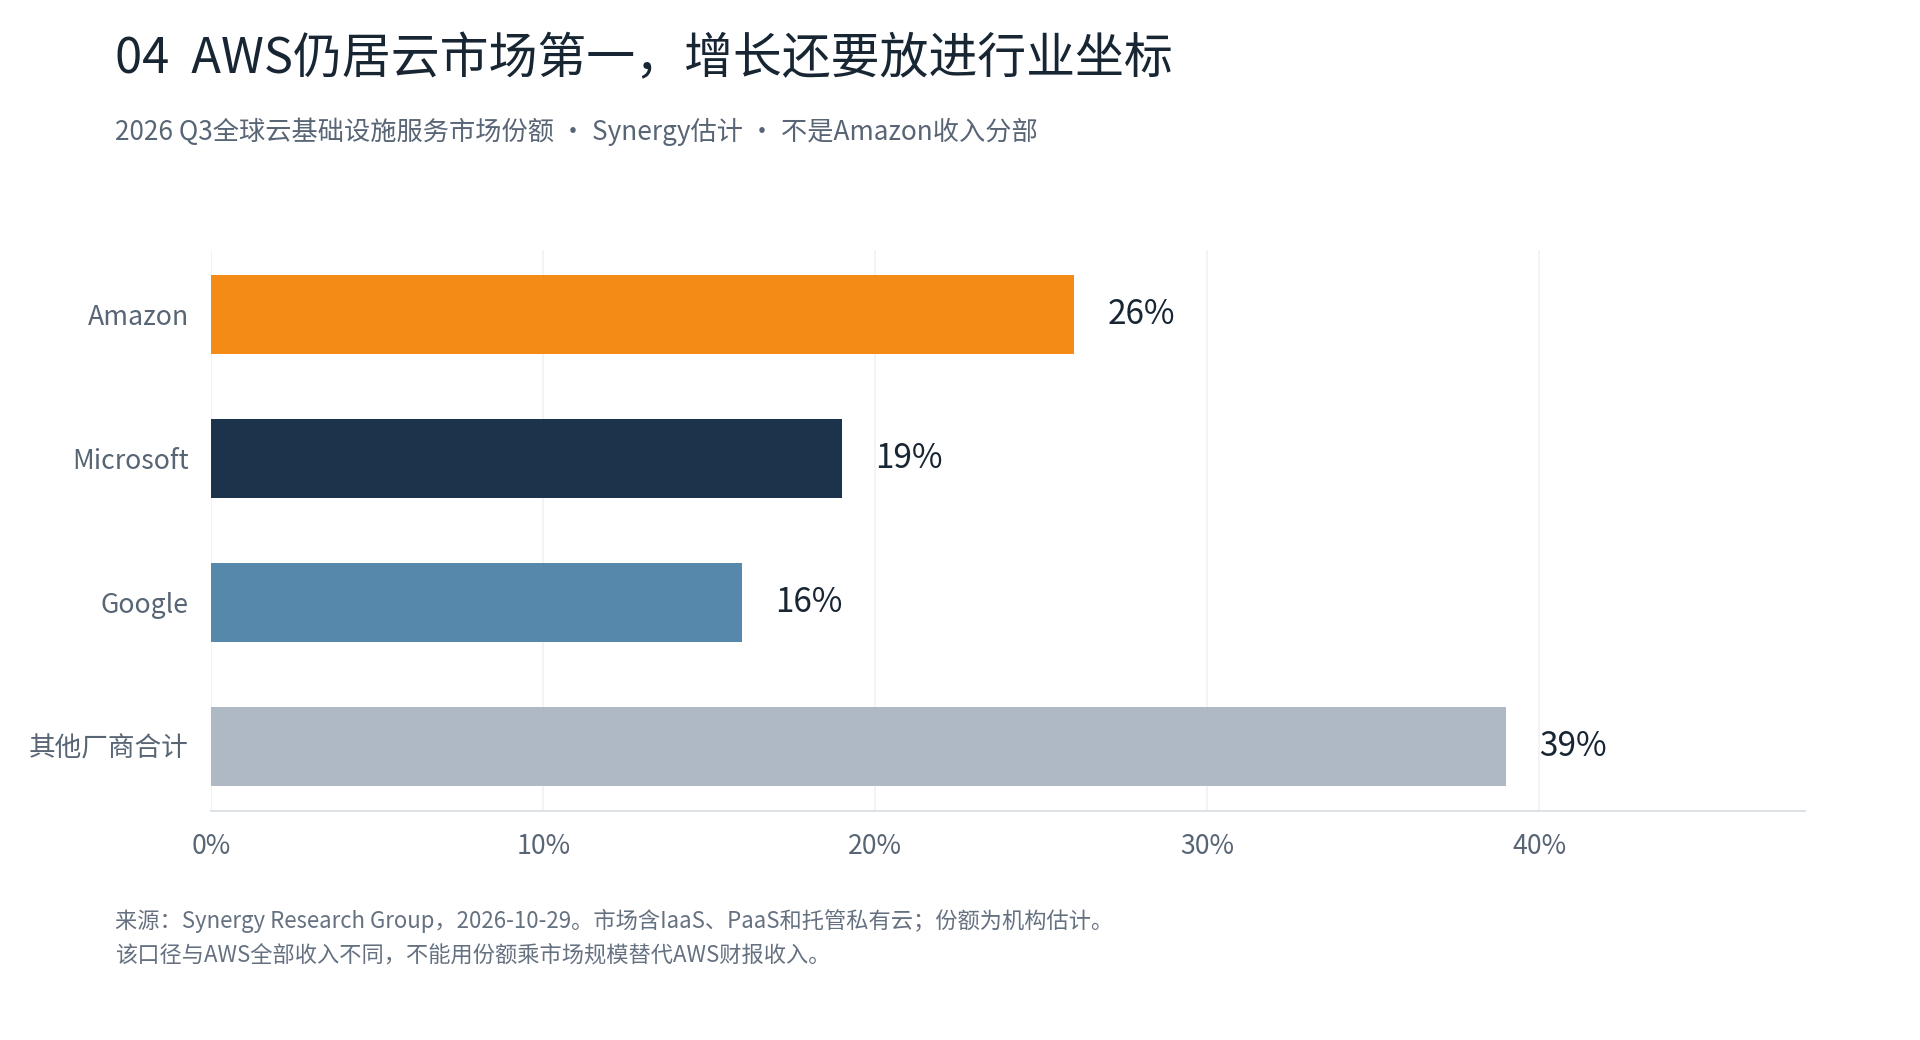
Investors should track share, contract delivery, and investment returns. Do not multiply 26% by total industry revenue to challenge AWS reported revenue; coverage differs.
For sellers, US holiday demand matters more. NRF expects November-December retail sales up 4.2%; Adobe expects online spending up 6.7%. The former covers broader retail excluding autos, gasoline and restaurants; the latter focuses online; do not subtract the two rates as channel shift. [4][5]
Both are nominal forecasts, including price and mix changes, so they do not imply equal unit growth or that every Amazon category follows.
Peak season operations must focus on individual products
Seller view: demand forecasts are for screening; spending should follow own returns.
Adobe’s forecast shows uneven growth across six major categories. Category trends can guide topic and product selection, but cannot replace own inventory, compliance, seasonality, and sales performance. [5]
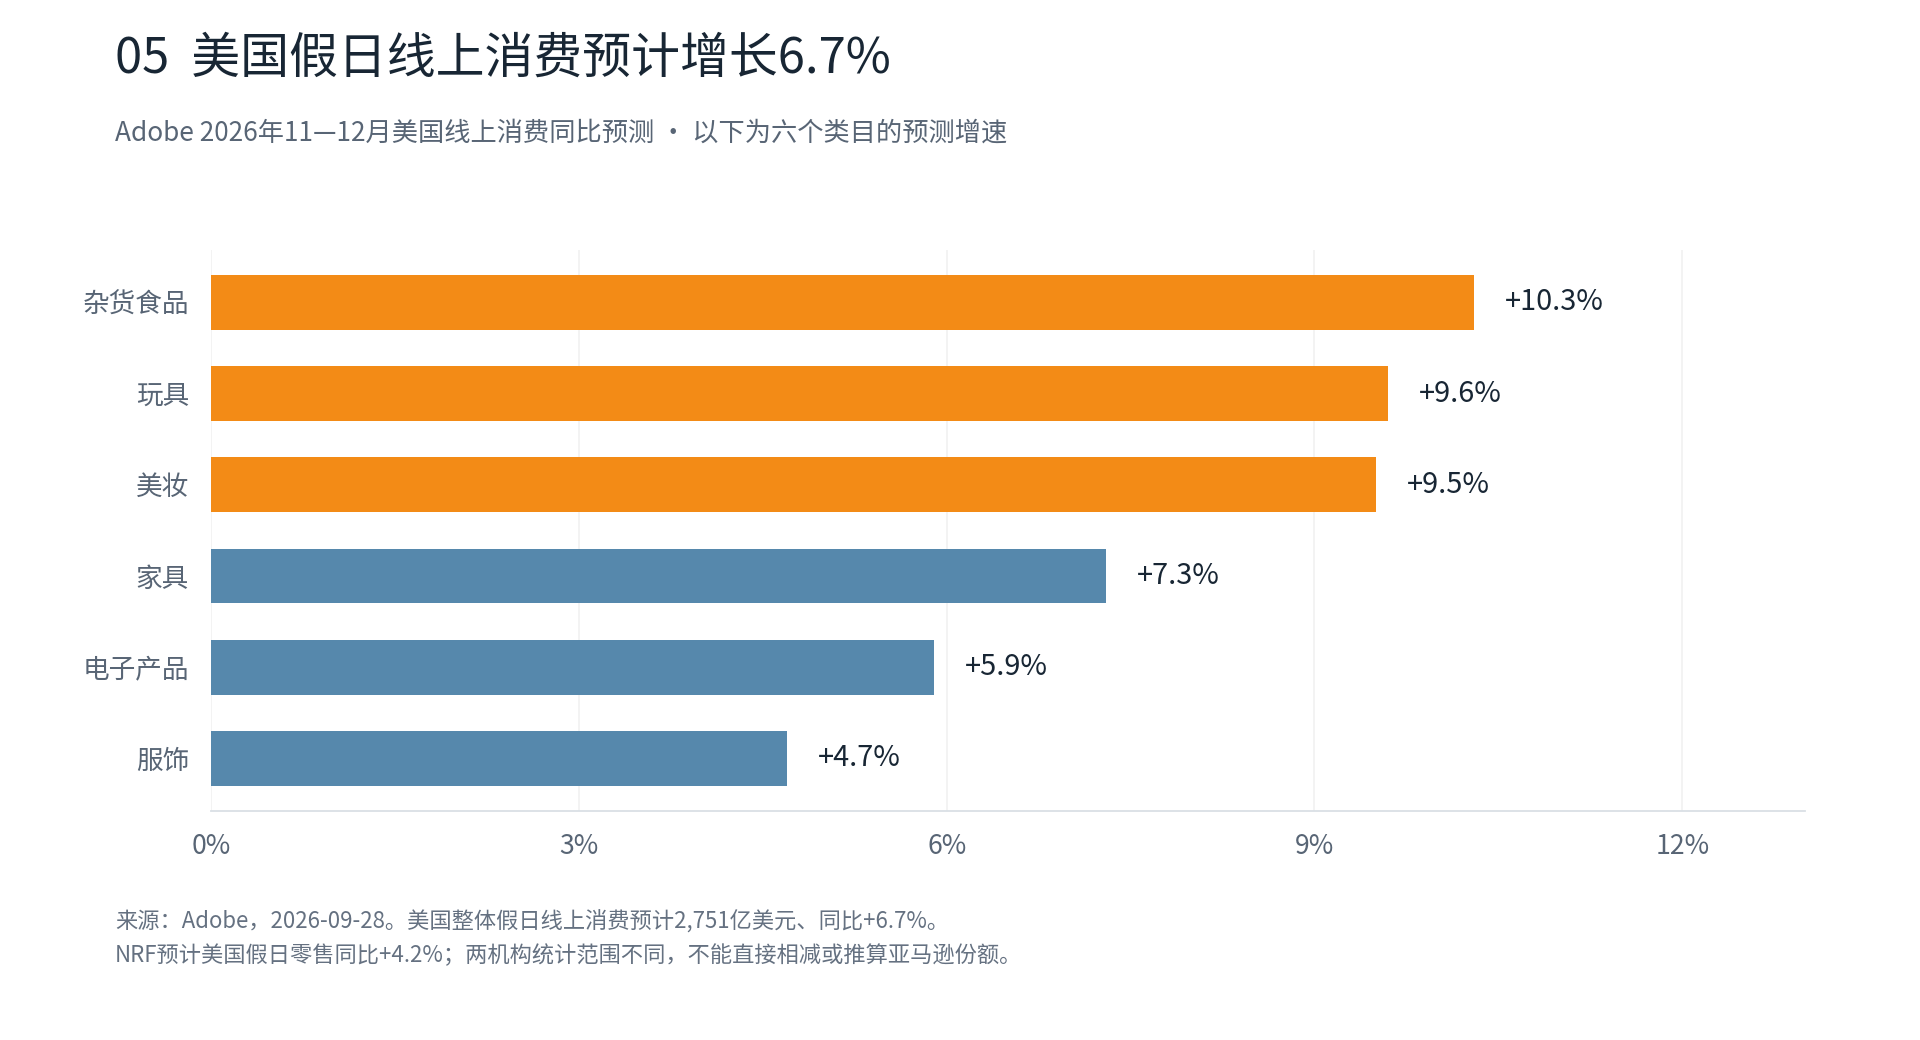
Chasing institutional category growth rates is too far from daily operations. For sellers with inventory ready, check which items sell steadily at regular prices, which need discounts, and which look overstocked but have limited promotional availability.
For a VIPON off-site test, use products with sufficient inventory and clear pages, not the whole store. Afterward, deduct discounts, fulfillment, promotion fees and estimated returns; see how much extra money remains, then plan the next round.