
 Amazon Global Store opening
The boss’s tough questions are back:
1. How are the store’s recent returns?
2.This ASIN’s return rate rose 5% this month—what’s the root cause?
3. Should we delist high-return products? If not fixed, our profits will be eaten up!
Return rate directly impacts store profit:
1. Newbie operator: Scrambles across pages for data, manually compiles reports, guesses reasons by experience—spends half a day without precise answers.
2.Top operator earning 50k monthly:Leverages Amazon AI Returns Dashboard to identify high-risk core ASINs, precisely dissect return reasons, and provide solutions!
Today, I’ll guide you step by step to reduce return rates with Amazon Returns and Value Recovery: Insights and Opportunities (AI Returns Dashboard) in 4 precise steps!
The Amazon AI Returns Dashboard, officially “Returns and Value Recovery: Insights and Opportunities,” is a new tool on Seller Central. It leverages AI to deeply analyze return patterns and buyer feedback, delivering one-stop analysis from big-picture data to precise insights.
Available marketplaces:
US, Europe (UK, FR, DE, IT, ES), Japan, Canada
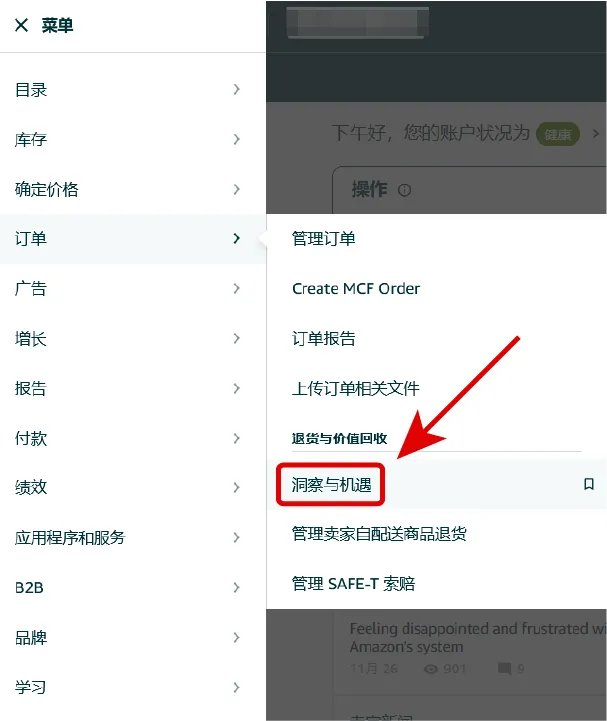
Seller Central path:
Orders > Returns and Value Recovery > Insights and Opportunities

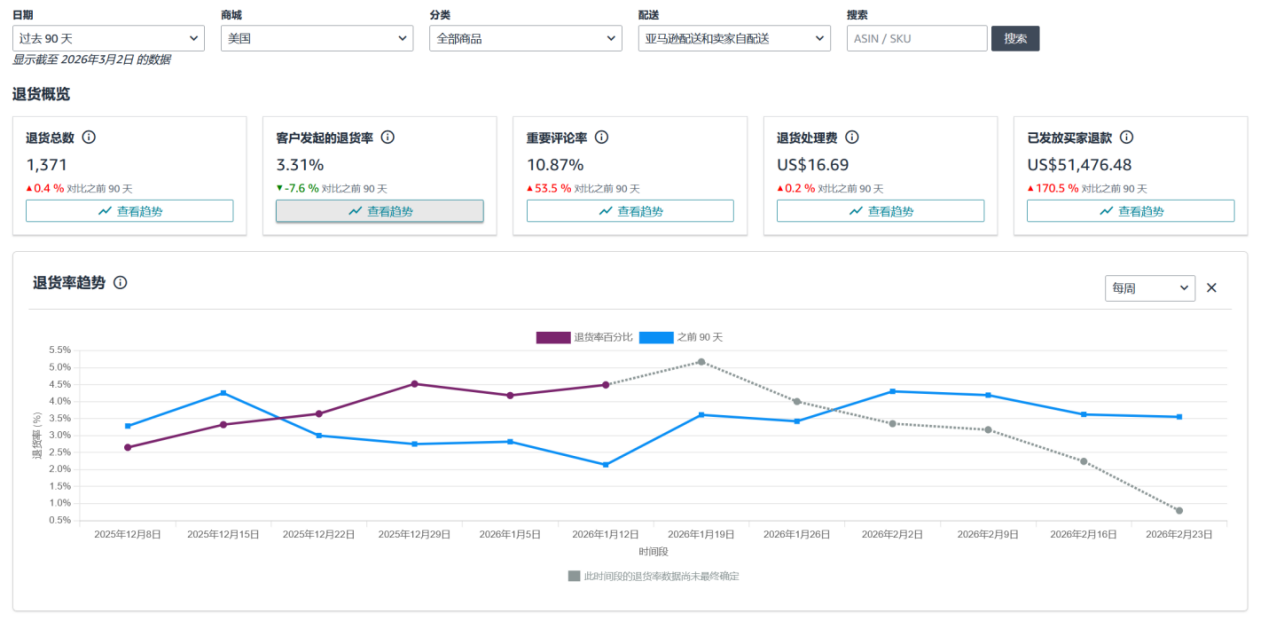
First set the big picture, then dive into details—key to efficient analysis! Once in the dashboard, filter by marketplace, category, and fulfillment channel, and you’ll see a 90-day return overview with key metrics, eliminating manual report compilation.

Return total and customer-initiated return rate are must-watch KPIs. For example, as of 2026/3/2, this store had 1,371 returns in 90 days and a 3.31% customer-initiated return rate (calculated as total returns ÷ total shipped units up to that date).
Common seller question: Why does dashboard data differ from my own stats?
Two main reasons:
1. The dashboard’s “Return total” includes refund-only and partial-refund items, providing a more comprehensive scope.
2. The return rate denominator is shipped units, not order count. For instance, an order with 10 items counts as 10 shipped units.

Click “View trend” next to metrics to see the current return rate (purple line) vs. the 90-day average (blue line). If purple consistently stays above blue, your return rate is trending up—pay immediate attention!
Common question: Why is part of the return rate curve gray?
Return rate data gradually finalizes over the return window. Gray lines represent periods not yet past the return window; those rates may later fluctuate upward due to pending returns—this is normal estimation display.
Step 1 conclusion:
Quickly gauge the overall return trend. For example, this store’s return rate is still relatively low at 3.31%, but it shows a persistent upward trend (purple above blue and rising), requiring attention.

Many sellers have hundreds of ASINs. Analyzing each is time-consuming. Pros focus on the big ones—prioritizing high-value, high-return ASINs. Use the dashboard to quickly pinpoint the core problem SKUs and avoid wasted effort.

Focus on the Return label status column—Amazon AI’s direct warning. Combine with order volume sorting: high-volume ASINs with warning labels are your top priority:
1. No label = Good, keep monitoring;
2. At Risk = Yellow alert, optimize urgently;
3. High Return Rate = Red alert, act immediately!



The dashboard shows the ASIN’s 3-month short-term and 12-month long-term return rate data, plus a category benchmark return rate, making optimization goals clear and measurable.
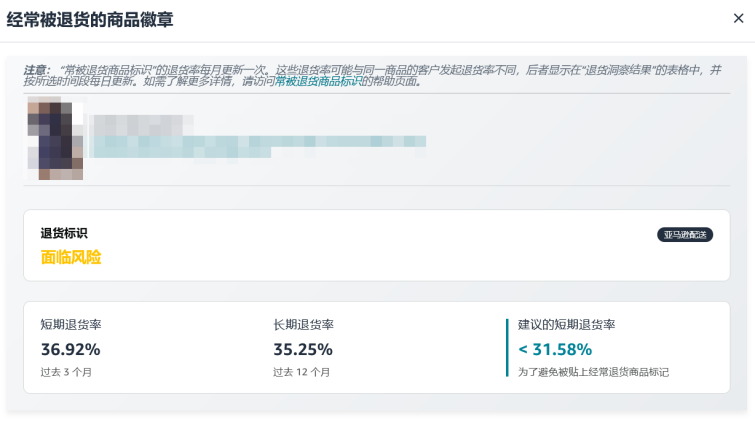
Common question: Why does the 3-month short-term return rate differ from the “customer-initiated return rate”?
Mainly due to update frequency: The “Frequently Returned Item” 3-month rate updates monthly, while the customer-initiated rate updates daily. This rhythm difference causes numerical variation.
Step 2 conclusion:
Out of 700+ ASINs, 43 are flagged red, 55 yellow. After sorting by order volume, prioritize the top 20 high-volume high-risk ASINs, focusing on the core to double efficiency.

Identify the right problem to prescribe the right cure. The pain point of returns analysis is biased data from buyers casually filling in reasons. Fortunately, Amazon’s AI Returns Dashboard is solving this by providing granular, precise return reasons, eliminating guesswork.

Amazon has optimized the buyer return flow: consumers now submit reasons via AI interactive chat, effectively avoiding random or perfunctory input. This precise feedback syncs directly into the dashboard, providing invaluable improvement insights.

Channel 1: Direct dashboard view.
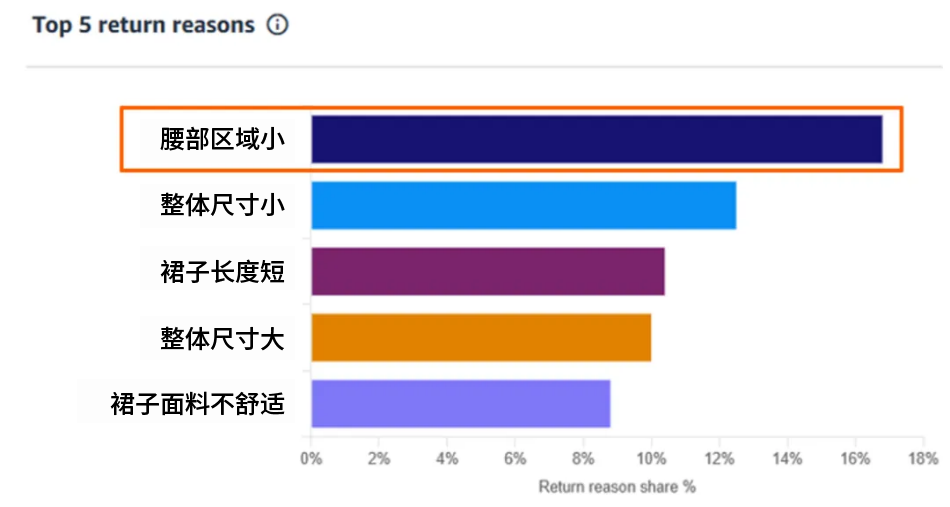
In the returns analysis section, enter the target ASIN and click return total to view trends. You’ll see AI-refined analysis combining historical return reasons and buyer reviews—no more vague “size too small,” but precise “waist area small” or “skirt length too short,” making the issue crystal clear.
Channel 2: Download reports for deep analysis.
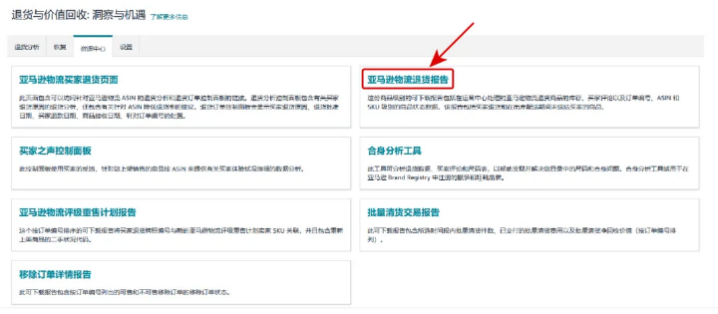
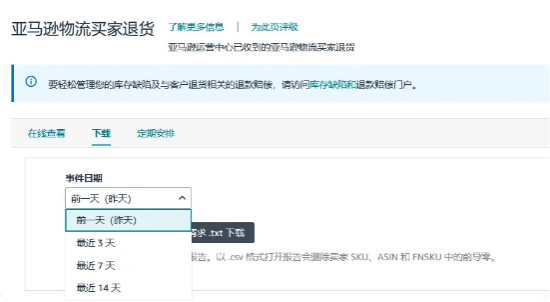
Download the FBA Returns Report from the dashboard Resource Center. Customer comments marked with vertical bars are precise reasons collected via AI chat. You can also use AI tools to summarize the report for more tangible insights.

How to download the “FBA Returns Report”:
Step 3 conclusion:
Pinpoint the exact return reason for the core ASIN, e.g., a dress’s key issue is “waist area too small”—guiding the next optimization clearly.

After finding the issue, you don’t need a costly product overhaul. Pros start by optimizing the product detail page, providing accurate info to reduce returns from mismatched buyer expectations. Low-cost trial that quickly shows results.
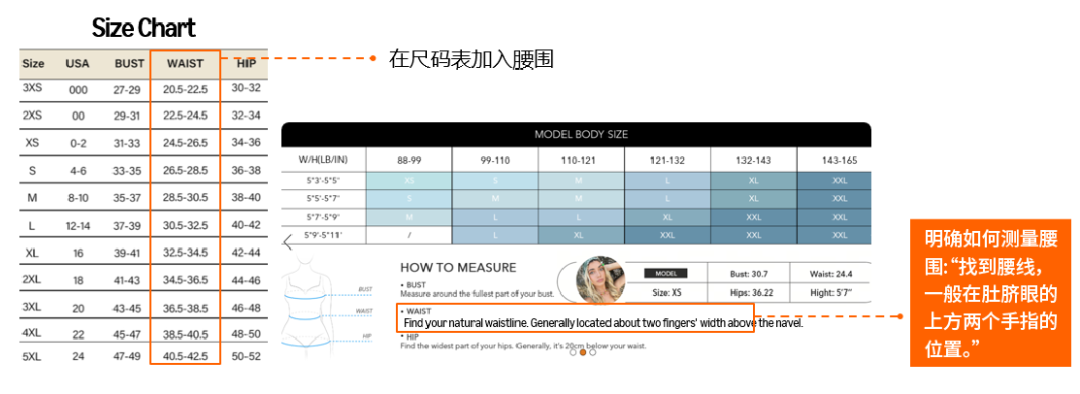
Taking the “waist area small” dress as an example, here are 3 reusable detail page optimization tips:
1. FAQ & bullet points to reinforce buying guidance: In the first FAQ, clearly remind: “Please prioritize waist measurement. Not recommended if waist exceeds XXcm, as fit may be tight and affect comfort.”

2. Clarify design attributes in A+ Content: Specifically note “Waist is a slim fit, suitable for slender waists” to calibrate buyer expectations upfront.

3. Add precise data to size chart: List specific waist measurements in the size chart and include a waist measurement illustration, enabling accurate size selection.
Step 4 conclusion:
After optimizing the listing, keep tracking the ASIN’s return rate trend via the dashboard to observe the effect. If no significant drop, then consider adjusting the product itself.
No more “blind men and the elephant” in returns analysis. Leverage Amazon Returns and Value Recovery: Insights and Opportunities (AI Returns Dashboard) following “See big picture → Pinpoint core → Find root cause → Fast implementation” four steps. Free yourself from tedious data crunching, achieve efficient and precise return management, steadily lower return rates, and boost profits!
Try it now on Seller Central!
Orders > Returns and Value Recovery > Insights and Opportunities
What challenges have you faced in returns management? Any exclusive tips to reduce returns? Share in the comments and unlock more operational insights~
For any Amazon questions, use the link (https://wsurl.cc/wg4chn) or scan the QR code to contact our official customer development manager: